HYSYS – Inductive Method
Prepared by Robert P. Hesketh Spring 2003
Styrene Reactor
Styrene is a monomer used in the production of many plastics. It has the fourth highest
production rate behind the monmers of ethylene, vinyl chloride and propylene. Styrene is made
form the dehydrogenation of ethylbenzene:
22565256 HCHCHHCHCHC +=−⇔− (1)
This reaction has several undesired side reactions that produce toluene and benzene:
356256 CHHCCHCHHC ⇔=− (2)
2266256 CHCHHCCHCHHC =+⇔=− (3)
Now let’s look at a simulation of an industrial reactor for styrene production. You will need to
get 2 files: a case file and a preference file. Return to
http://engineering.rowan.edu/~hesketh/0906-316/index.html and save the files styrene
inductive.hsc and styrene.prf. The following link may work:
http://engineering.rowan.edu/~hesketh/HYSYS_files/styrene%20inductive.hsc
http://engineering.rowan.edu/~hesketh/HYSYS_files/styrene.PRF
Next load a preference set called Styrene.prf also found in the same folder.
If you would like to read the help manuals for HYSYS they are located at
http://engineering.rowan.edu/~hesketh/hysyshelp/Menu.pdf
Open the workbook and do the following:
1. Why are there heaters between each reactor. Sketch the temperature, pressure and
composition profiles in these reactors.
2. What would happen if the heat duty on each of the reactors was set to zero? To do this
you must remove heater outlet temperature specifications and set the duty to zero.
3. Examine the effect of varying the inlet temperature to the first reactor on the outlet
compositions of this process.
4. Examine the effect of varying the inlet pressure outlet compositions of this process.
Write and sketch your answers on a separate sheet of paper.
1
Now let’s look at some of the tools in HYSYS
Spreadsheet:
To easily access the variables you may want to use the spreadsheet function within HYSYS.
1. Go to the help files and skim the topic in HYSYS 2.4, Steady-State Modeling,
Chapter 10 Logical operations, section 10.6 Spreadsheet. See the link to HYSYS
help on the Chemical Reaction Engineering Homepage.
http://engineering.rowan.edu/~hesketh/0906-316/index.html or go directly to help
using http://engineering.rowan.edu/~hesketh/hysyshelp/Menu.pdf
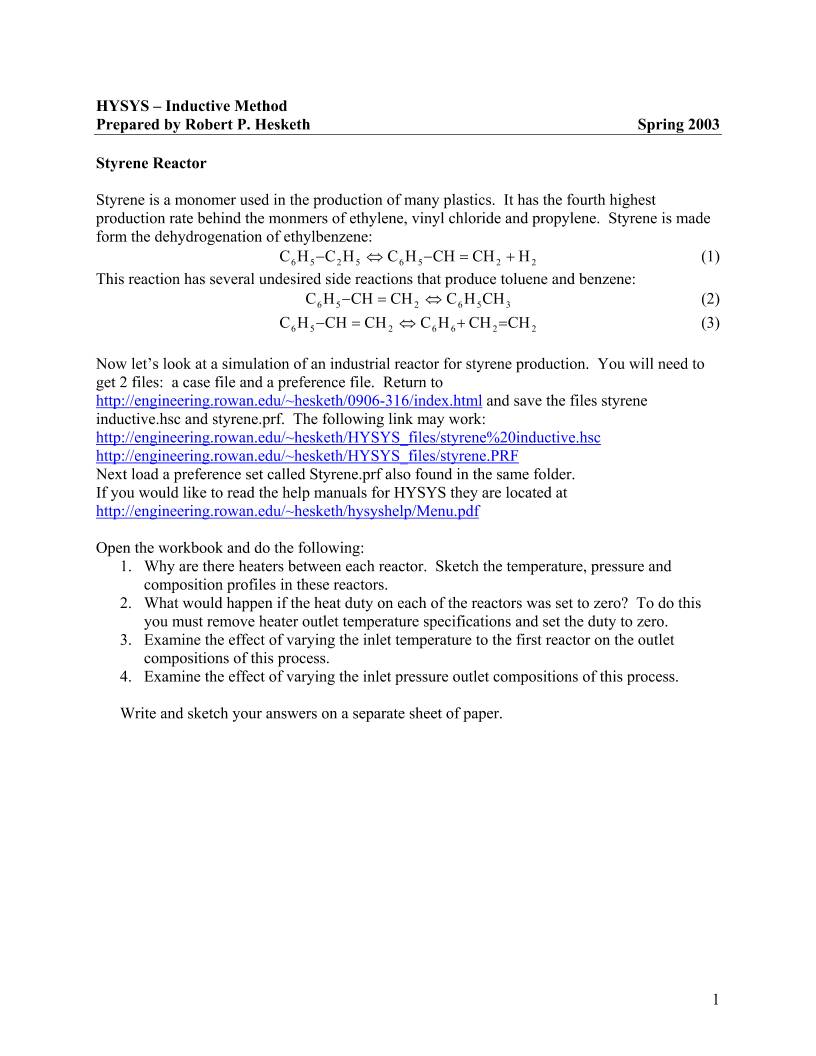
2. Open the spreadsheet by using the Flowsheet, Add Operation, click on Logicals radio
button and select Spreadsheet.
To easily calculate the conversion of the 3 reactor system install the appropriate variables.
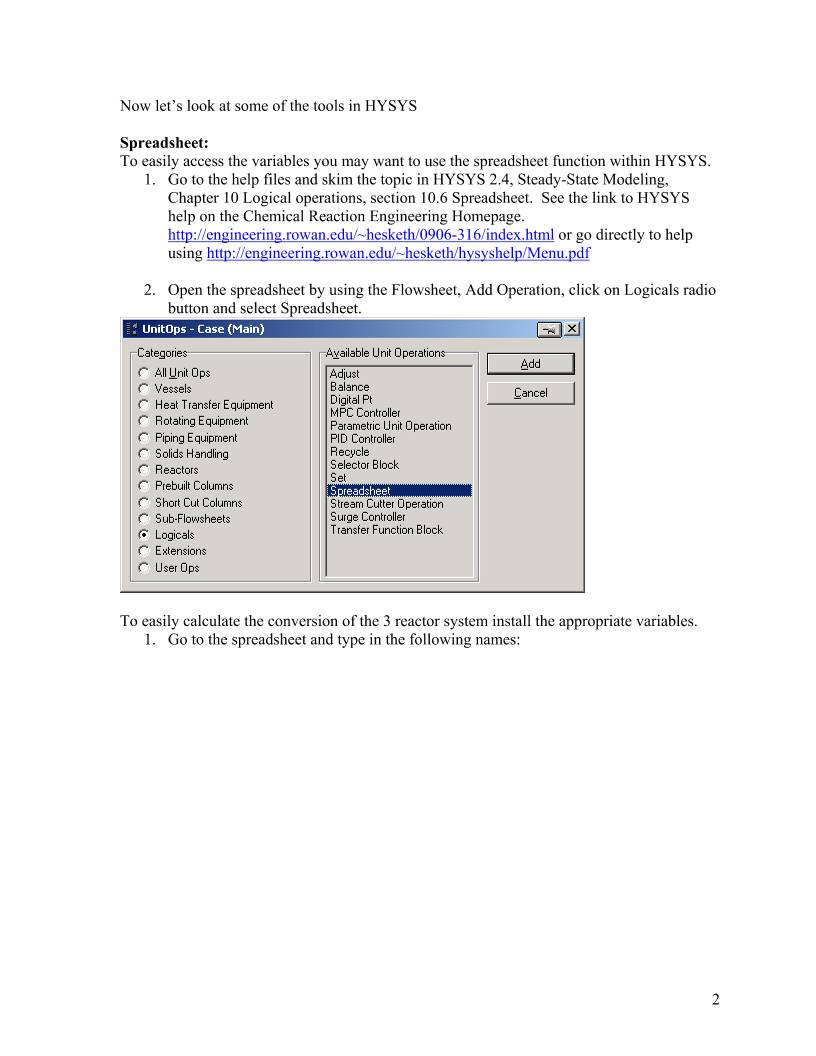
1. Go to the spreadsheet and type in the following names:
2
In your
simulation
you must
click on
the push
pin to
remove
this button
2. End by clicking on cell B1
3
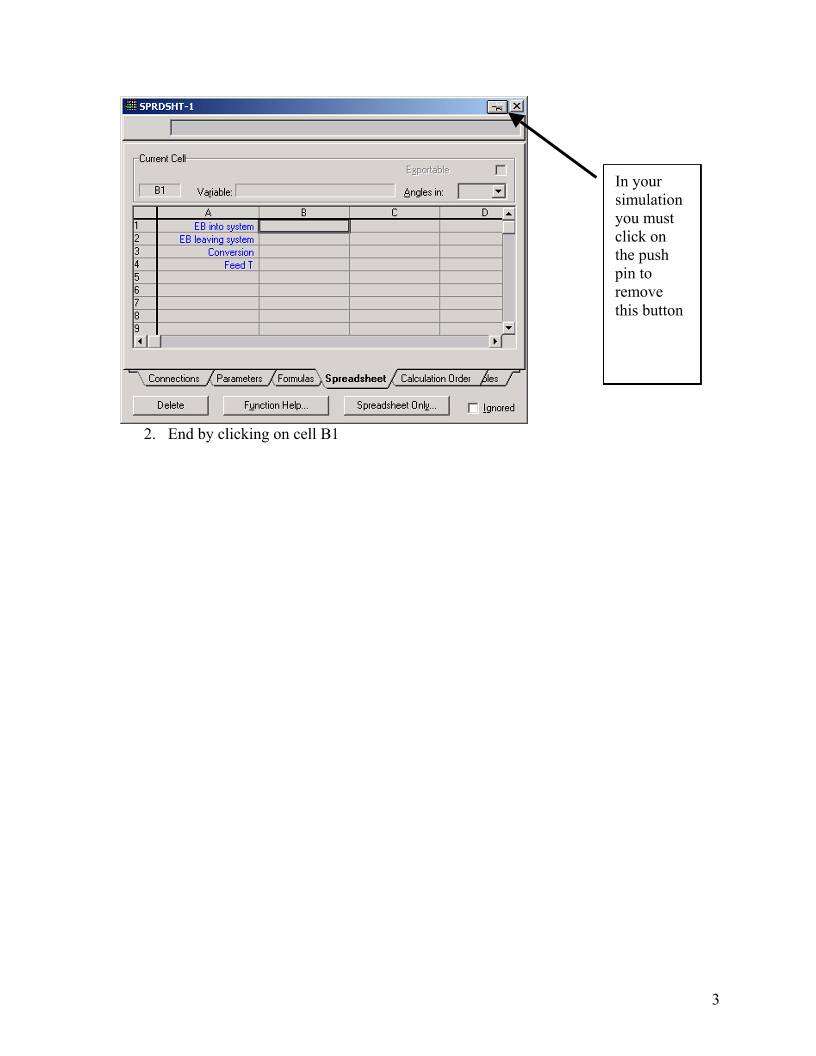
3. Using the Edit Import button bring in the following variable:
4. Notice that it has placed this in Cell A1. Change this to B1 in the cell edit window.
5. Another way to bring in a variable is to drag it into the spreadsheet. (See section
10.6.2). As stated in the help click and hold the right mouse button and drag it over
to the spreadsheet in the desired location.
6. Next calculate conversion of ethylbenzene in this reactor as shown in Equation 4.
( )
Ao
AAo
A F
FF −
=χ (4)
7. To see the effect of changing feed temperature on conversion drag the temperature
(holding the right mouse button and dragging.)
8. Comment on the effect of inlet temperature on conversion.
In your
simulation
you must
click on
the push
pin to
remove
this button
to remove
it
4
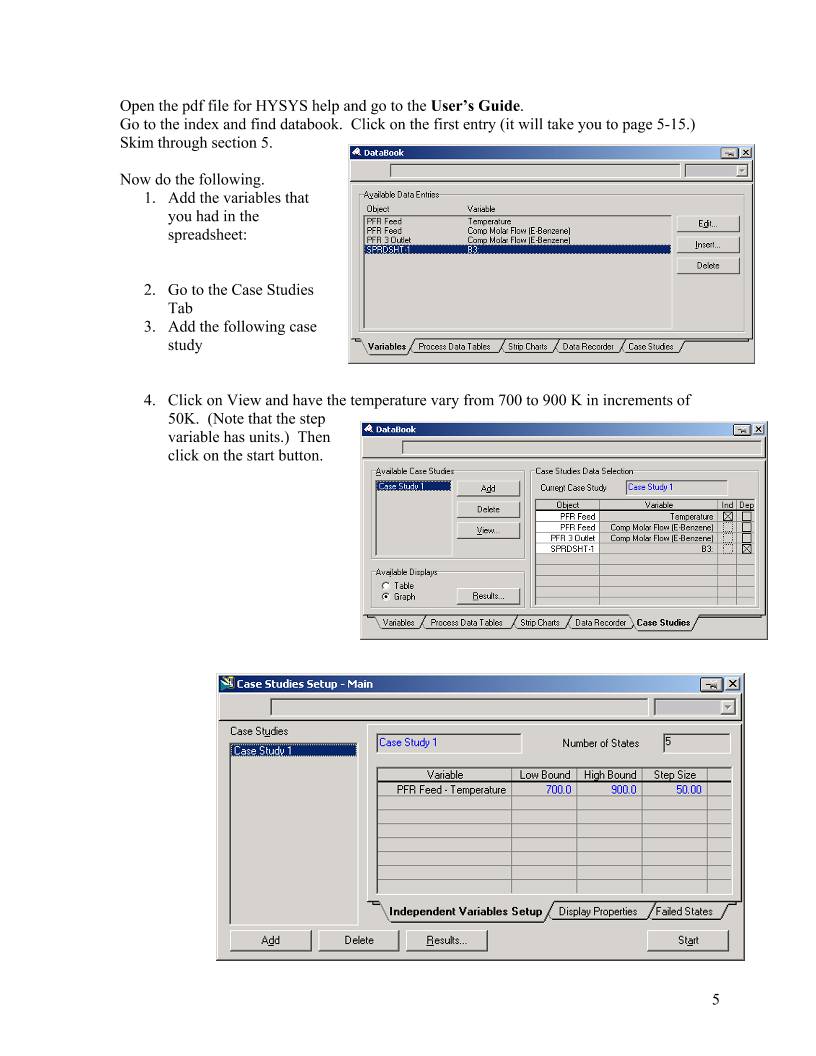
Open the pdf file for HYSYS help and go to the User’s Guide.
Go to the index and find databook. Click on the first entry (it will take you to page 5-15.)
Skim through section 5.
Now do the following.
1. Add the variables that
you had in the
spreadsheet:
2. Go to the Case Studies
Tab
3. Add the following case
study
4. Click on View and have the temperature vary from 700 to 900 K in increments of
50K. (Note that the step
variable has units.) Then
click on the start button.
5
The result is the following in
graphical form. The alternative form
is a table which could be copied to a
spreadsheet for future graphing.
To place in a spreadsheet use the
copy with labels feature:
Now you can examine the effect of
many other variables such as
pressure, heat duty etc.
6
7
Submit at the end of class:
1. Answers to page 1 questions.
1.1. Why are there heaters between each reactor. Sketch the temperature, pressure and
composition profiles in these reactors.
1.2. What would happen if the heat duty on each of the reactors was set to zero? To do this
you must remove heater outlet temperature specifications and set the duty to zero.
1.3. Examine the effect of varying the inlet temperature to the first reactor on the outlet
compositions of this process.
1.4. Examine the effect of varying the inlet pressure outlet compositions of this process.
2. Graphs showing the following:
2.1. Effect of Feed Temperature on conversion at Pinlet=1.378 bar
2.2. Effect of Feed Pressure on Conversion at Tinlet=880K
2.3. Effect of heat duty on conversion – (either 1 or both heaters)
 WMS仓库系统